Hate impacts everyone and leaves no community highlighted in the Communities Against Hate initiative behind.
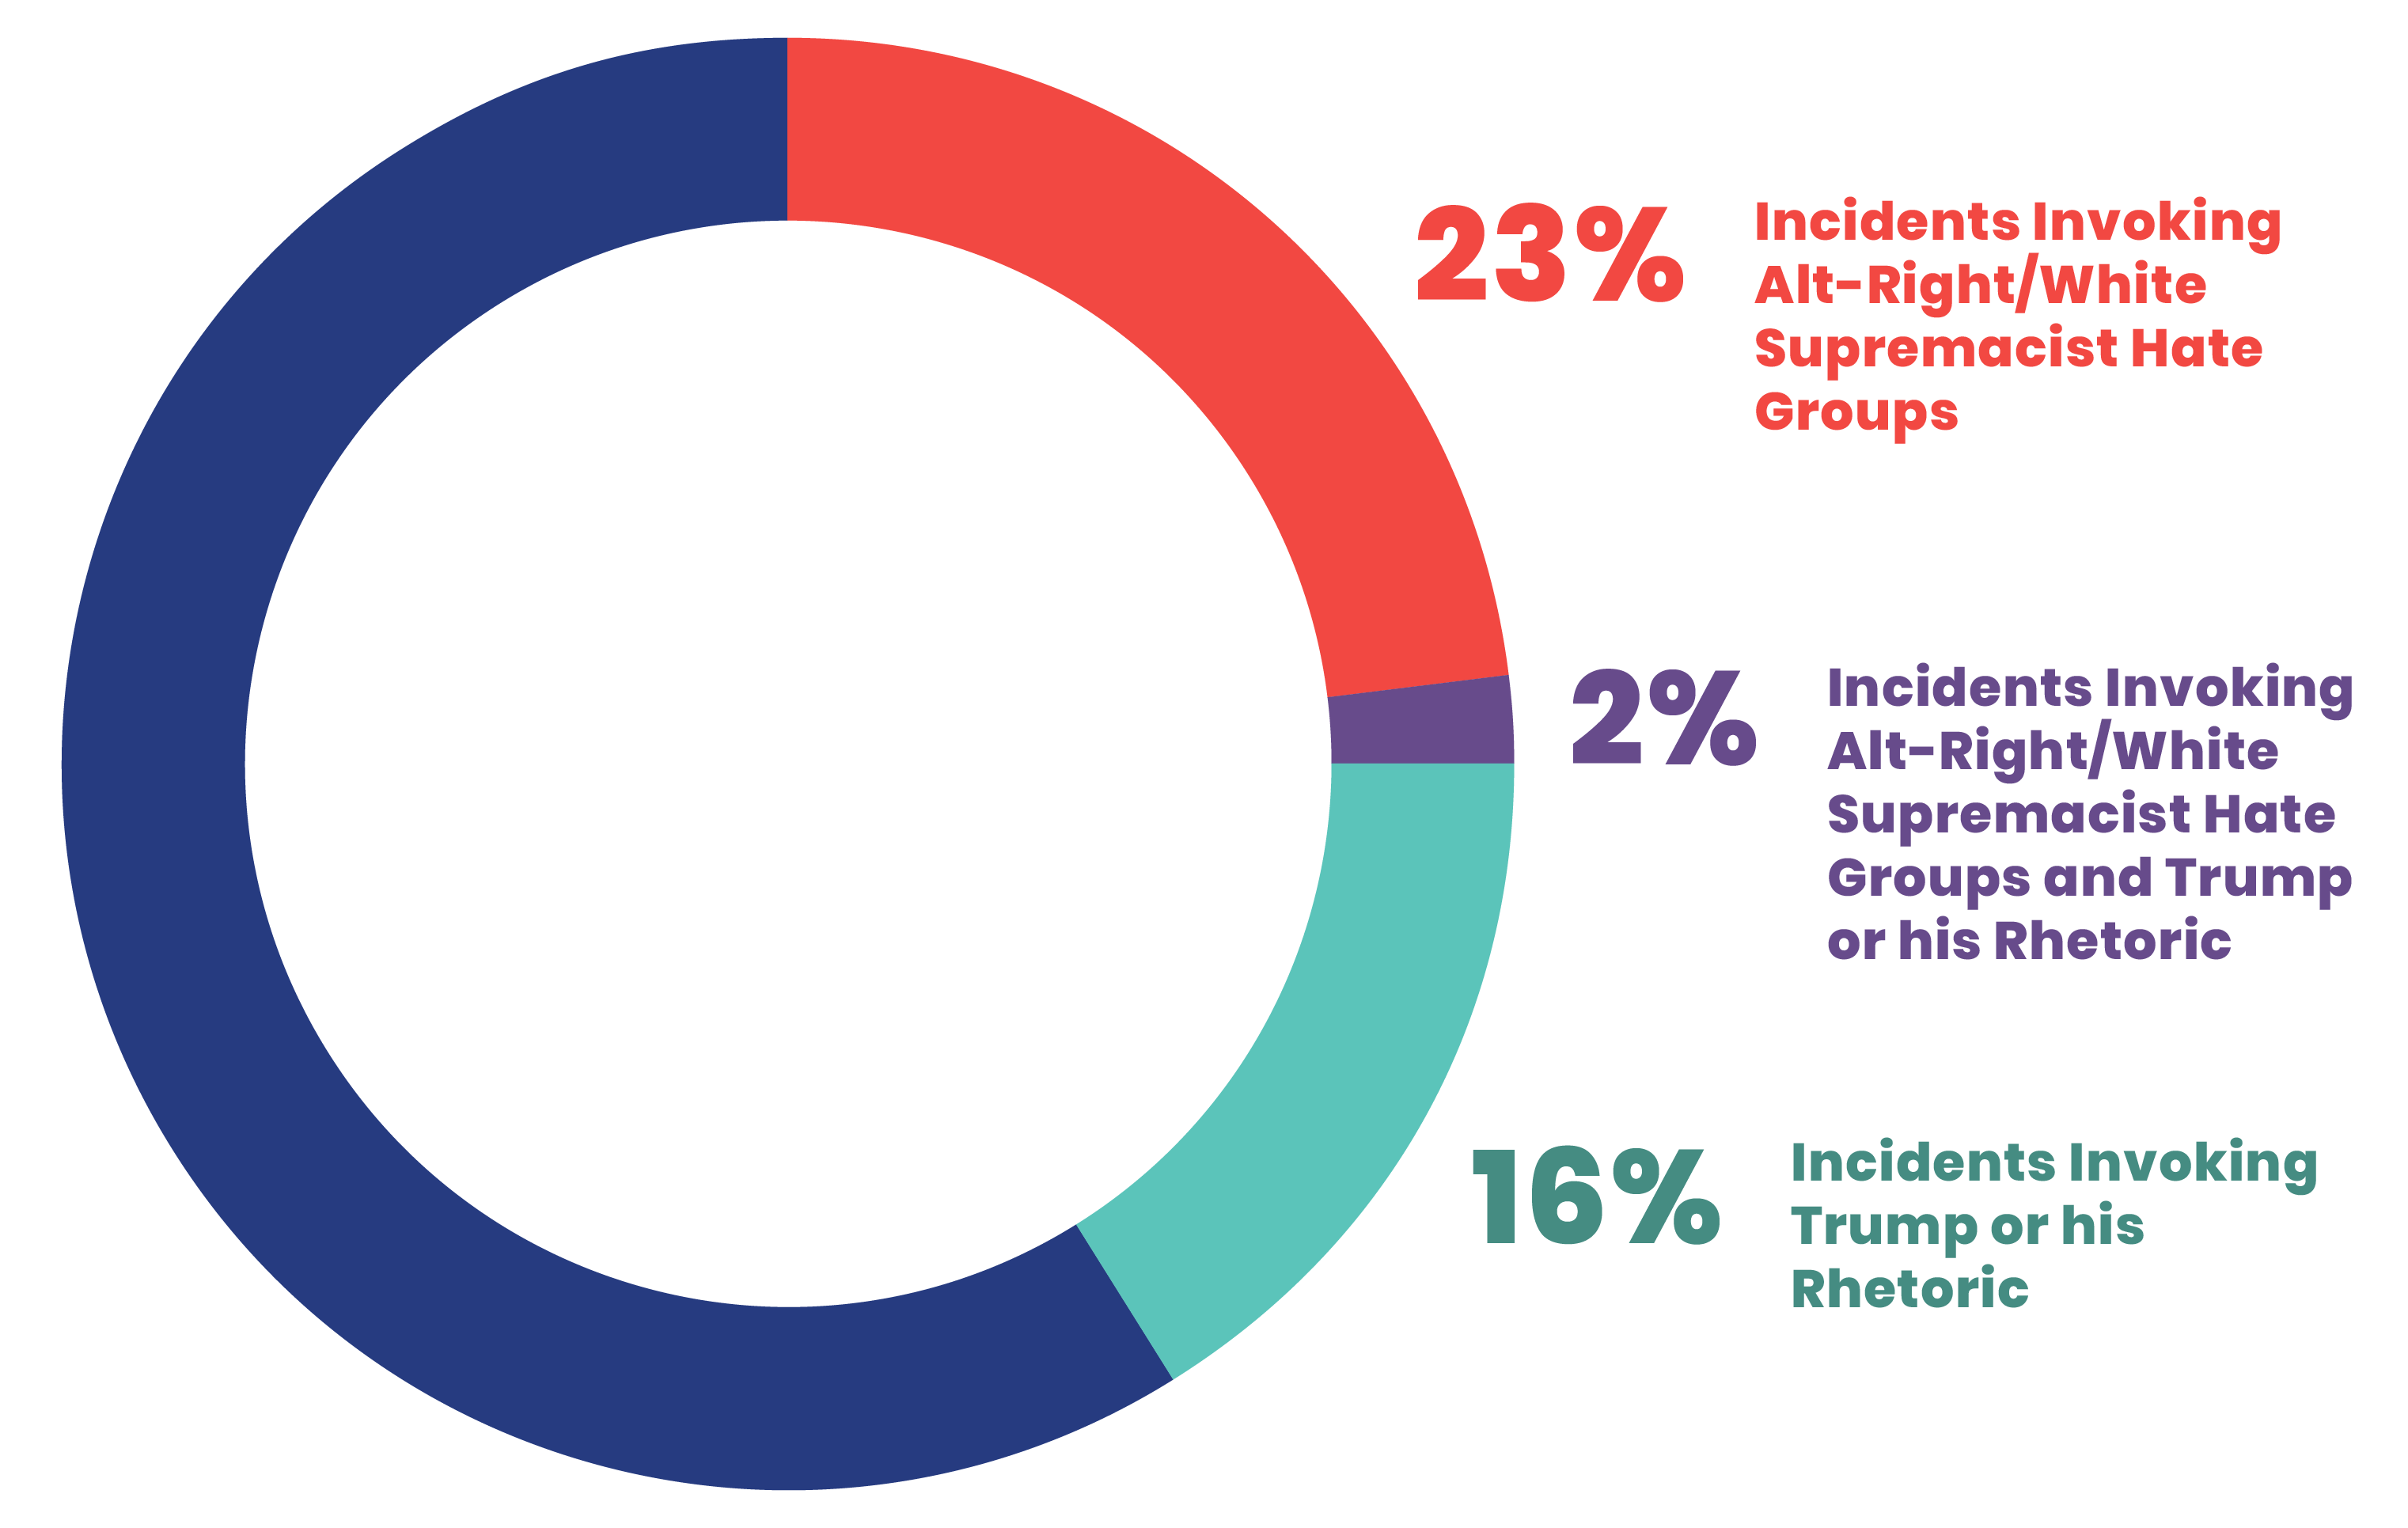
We see this in our data. We also see that the current political climate impacts the state of hate given the troubling findings in our database of the number of incidents of hate committed where the name or idea of an alt-right hate group, President Donald Trump or Trump-related rhetoric, or other hate groups were invoked.
Our analysis of the incidents reported to the Communities Against Hate database seeks to provide a better understanding of hate incidents occurring today. The types of incidents reported include physical, verbal, and written abuse; refusal of rights; stolen property; intimidation; and sexual intimidation or harm. This report outlines an analysis of the hate incidents2 in the Communities Against Hate (CAH) database and the findings of our Hate Incidence Poll. Hate incident is here defined as: A bias motivated incident committed, in whole or in part, because of actual or perceived race, color, religion, national origin, gender, sexual orientation, gender identity, disability, and/or ethnicity. Hate incidents may or may not constitute a crime.
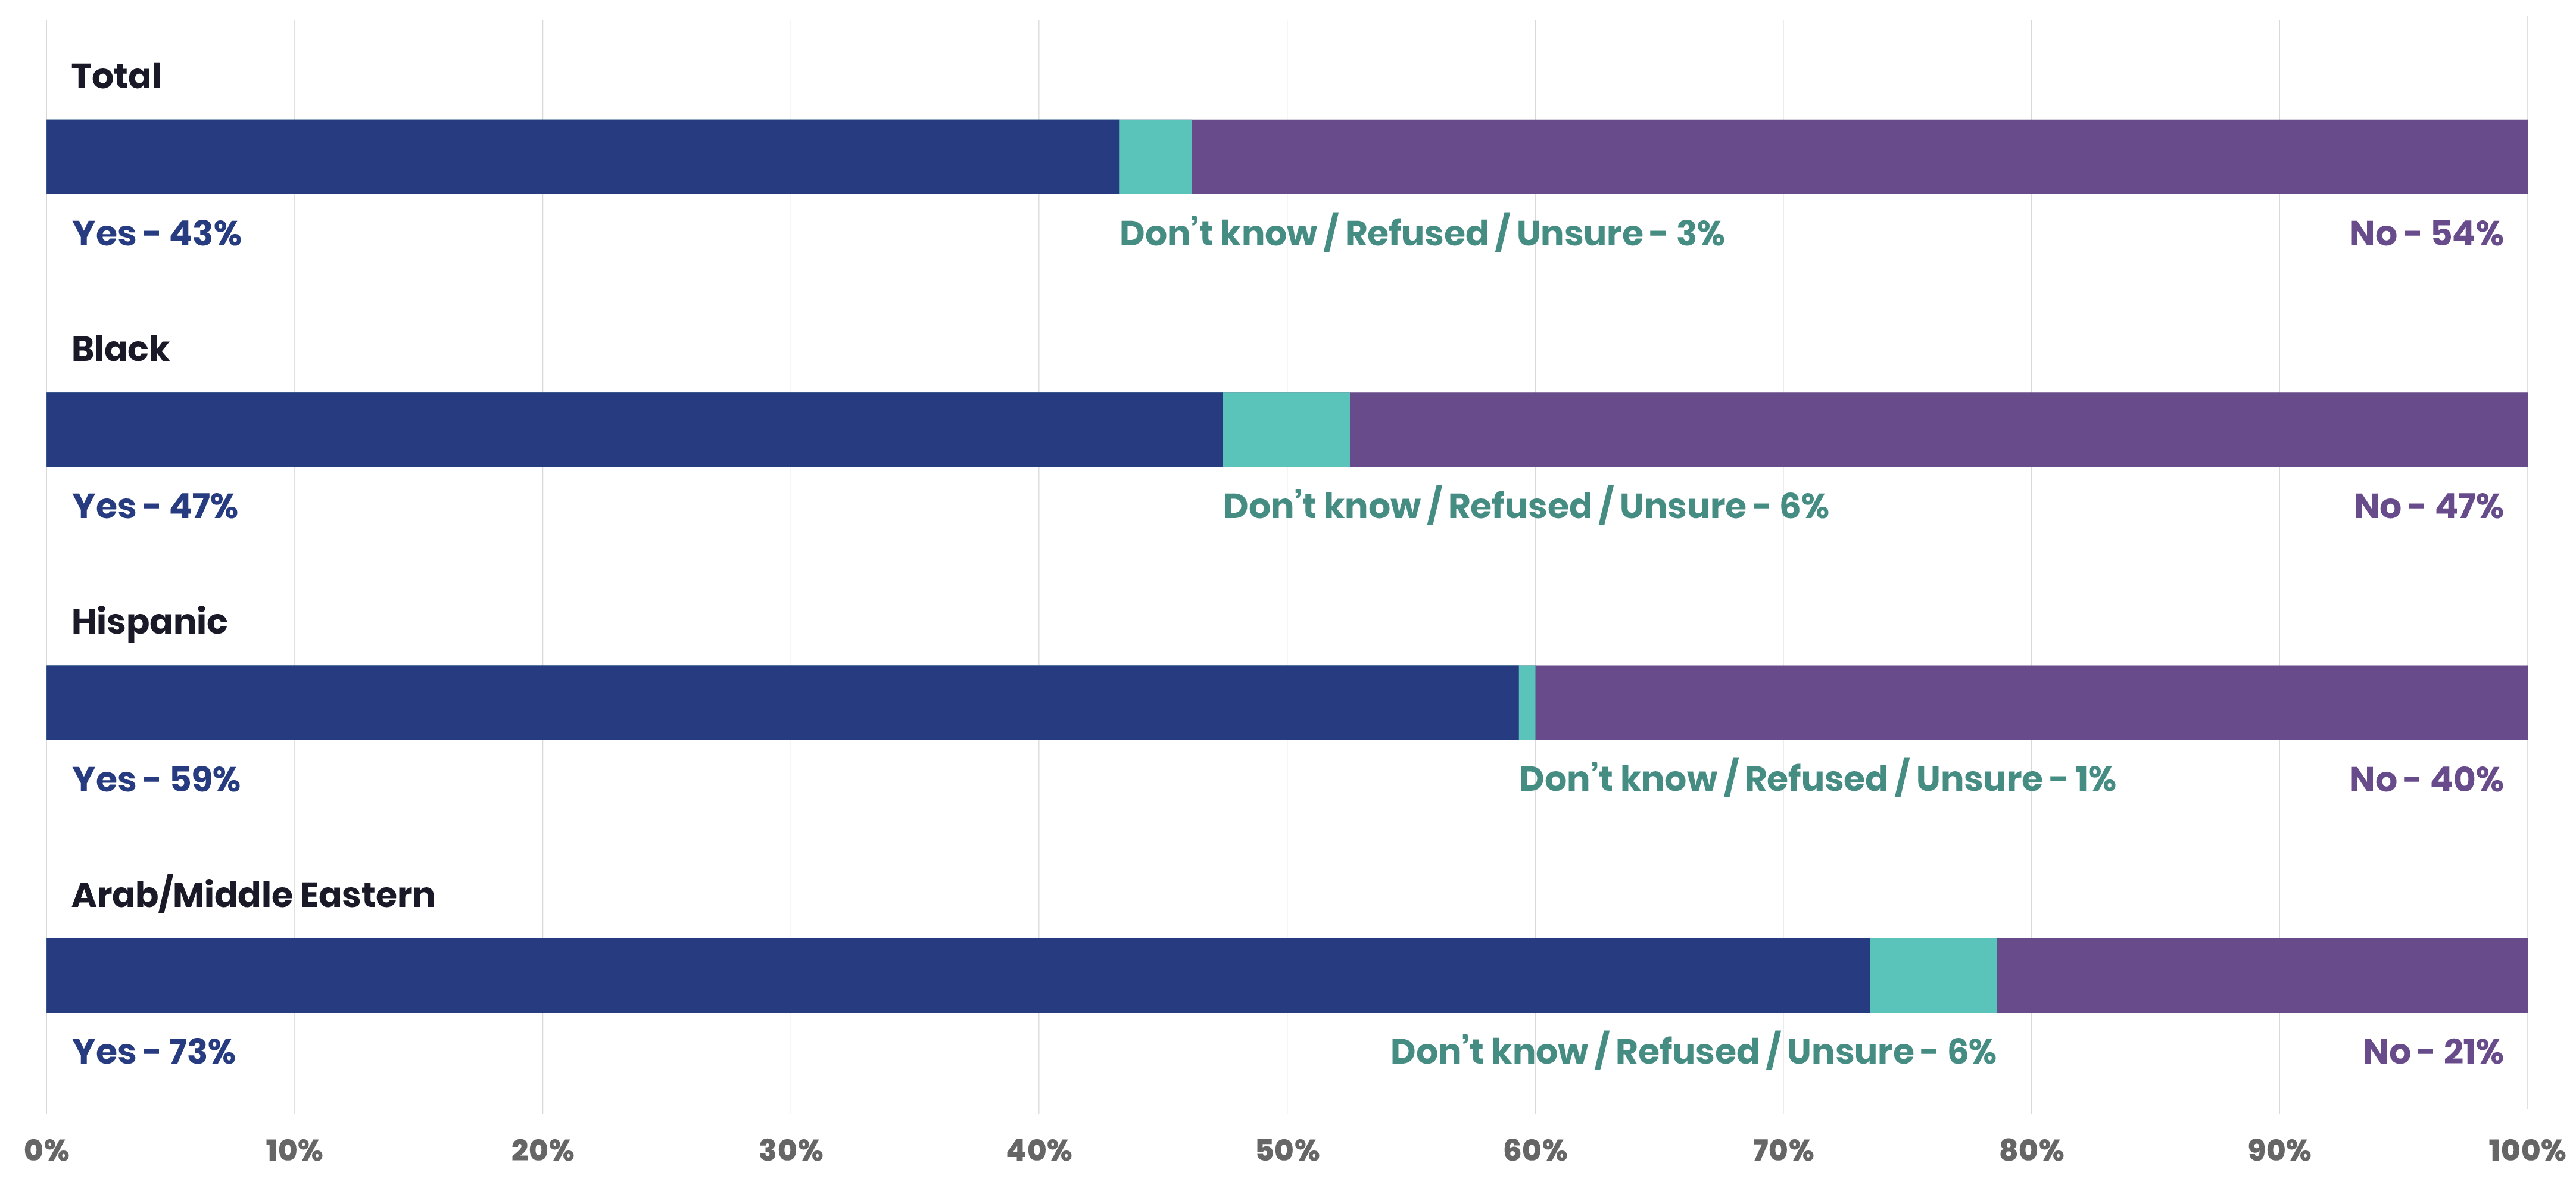
The Hate Incidence Poll finds that 43 percent of total respondents state that they experienced or witnessed a hate incident in the past two years. Of those respondents, 47 percent are Black, 59 percent are Hispanic, and 73 percent are Arab/Middle Eastern. The CAH database showed similar reporting as it relates to demographics impacted, with anti-Black/African-American biases being present in 858 (23.47 percent) incidents. Anti-Muslim was selected in 542 incidents (14.82 percent). Anti-Latino/Hispanic was selected as the motivation in 332 incidents (9.08 percent). Similarly, a majority of Hate Incidence Poll respondents (66 percent) stated that the perceived motivation behind the most significant incident was race or ethnicity. Religion was third most selected at 35 percent in the poll.
From our findings, it is clear that people are experiencing hate in alarmingly high numbers. This conclusion was further reinforced by the FBI in November 2018, when it released its annual report on the hate crimes data it received in the previous year. The most recent data from the FBI documented that hate crimes increased by 17 percent, making it the third consecutive year that reported hate crimes have increased. This FBI data almost certainly understates the true numbers of hate crimes committed as victims/survivors may be fearful of authorities and thus may not report these crimes to law enforcement. For that reason, these numbers only begin to paint a picture.
2. Of the nearly 4,000 incidents in the CAH database, 93 percent of them (3,656) are hate incidents.
Use of Language
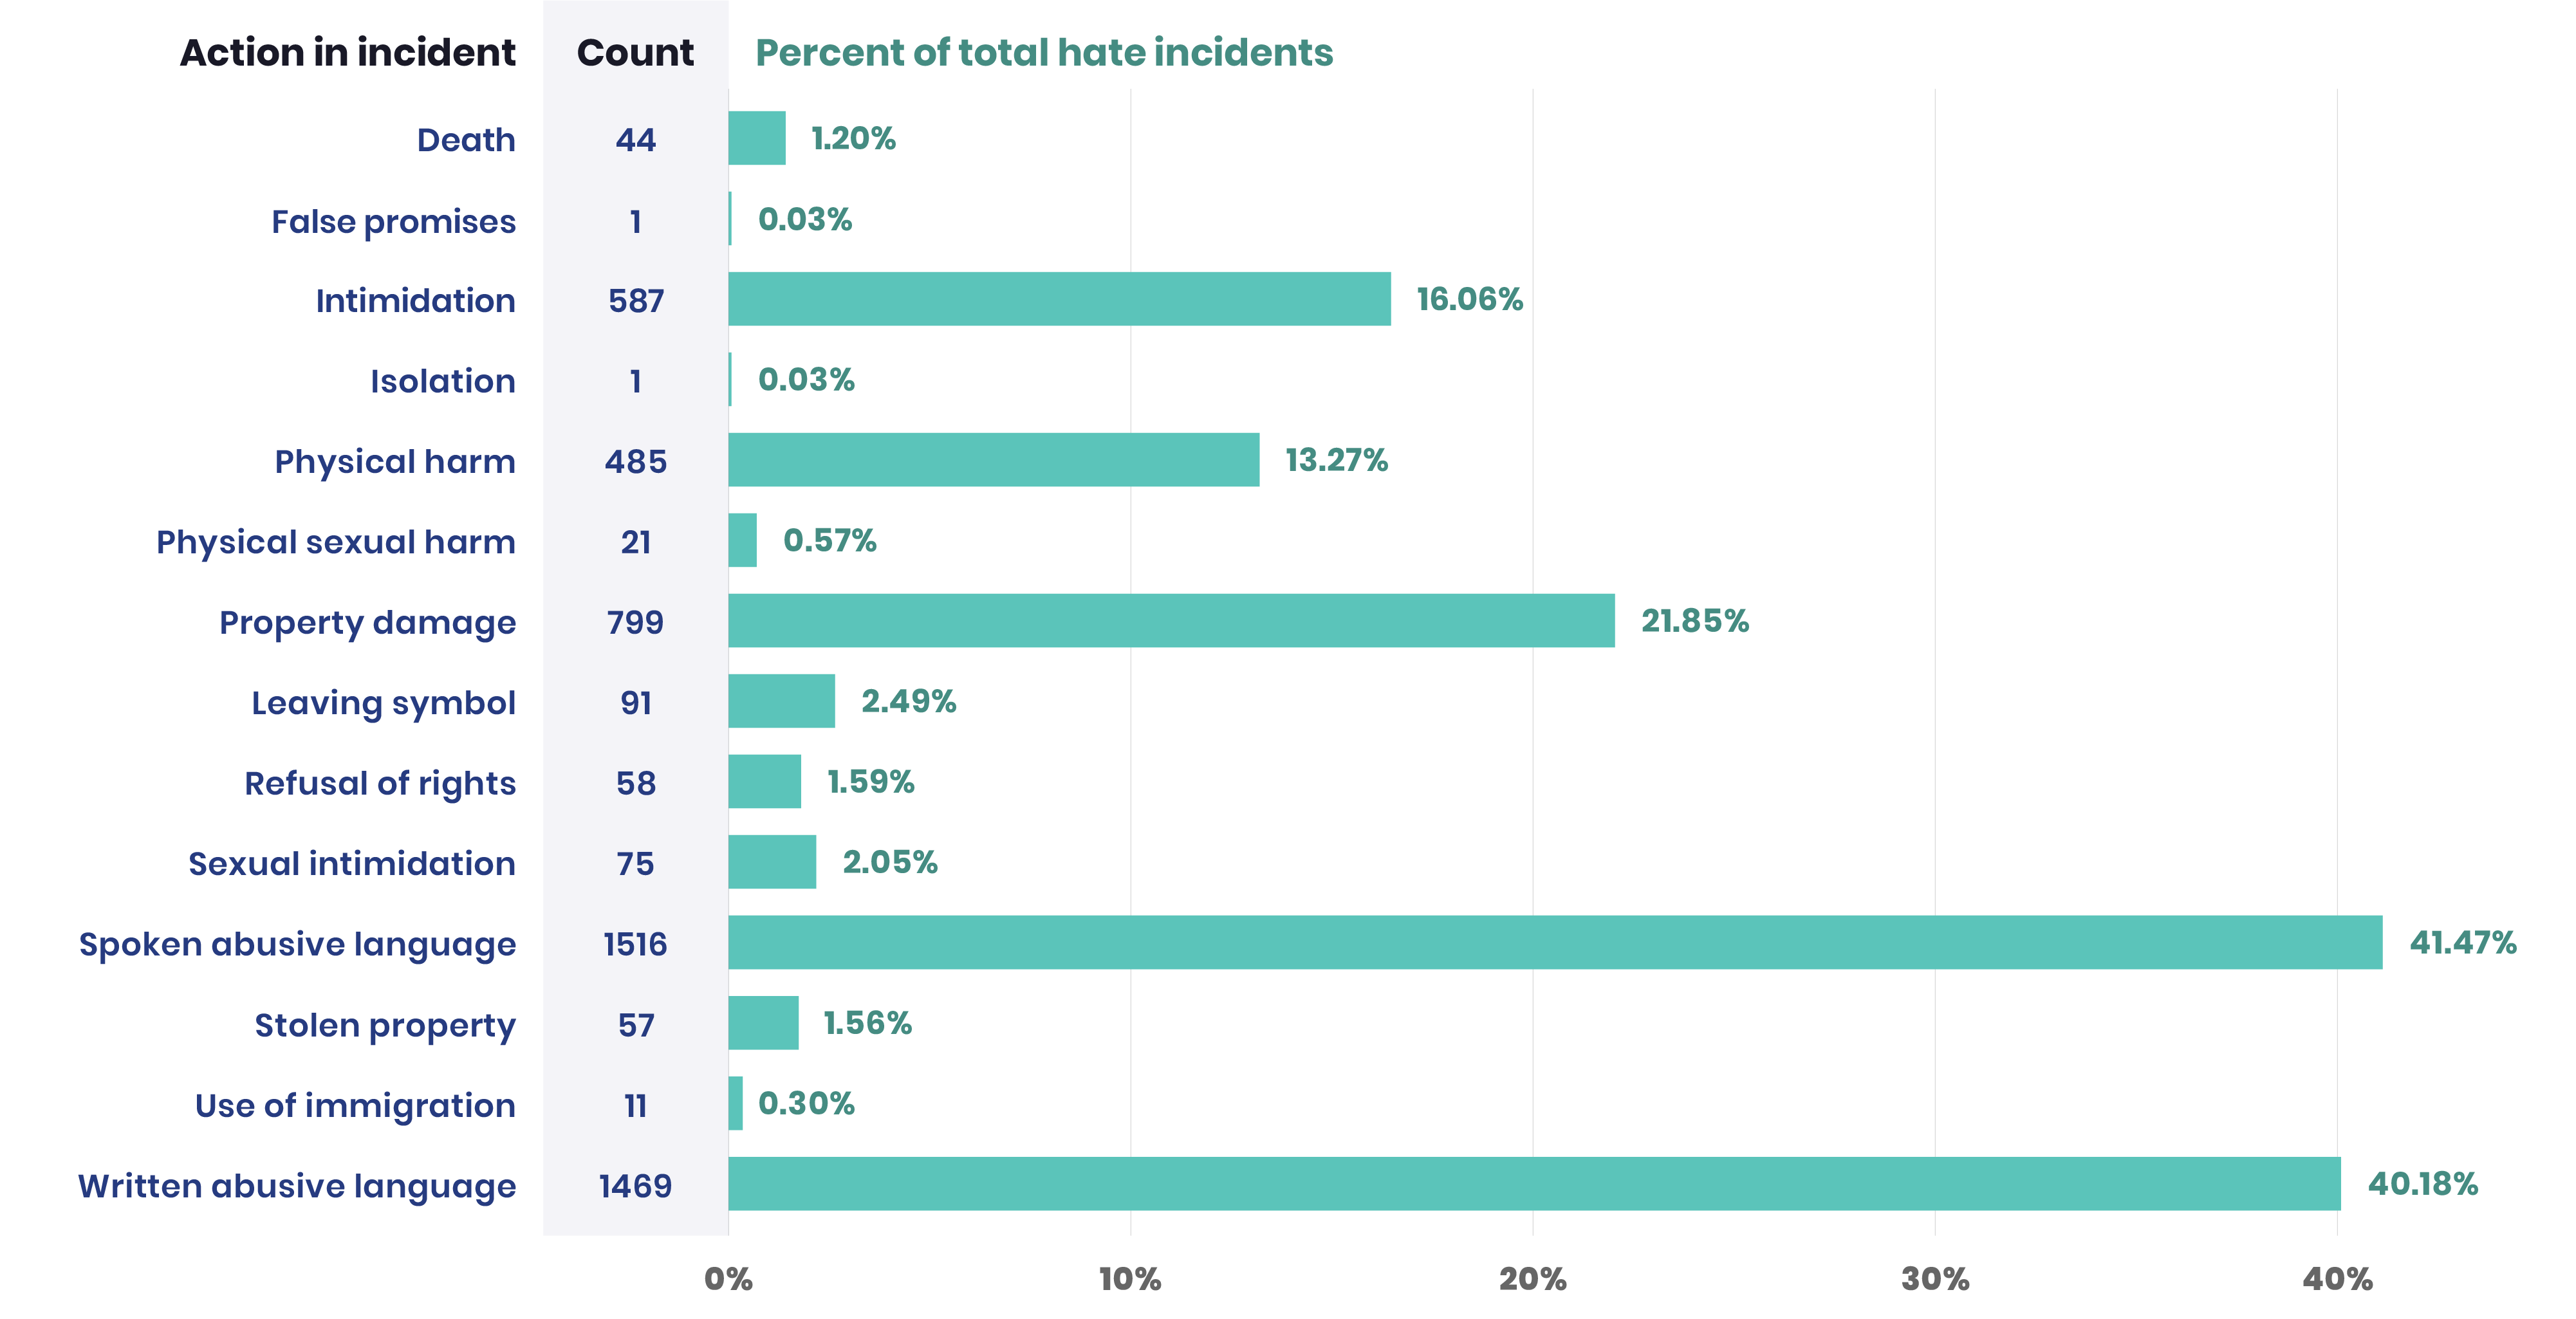
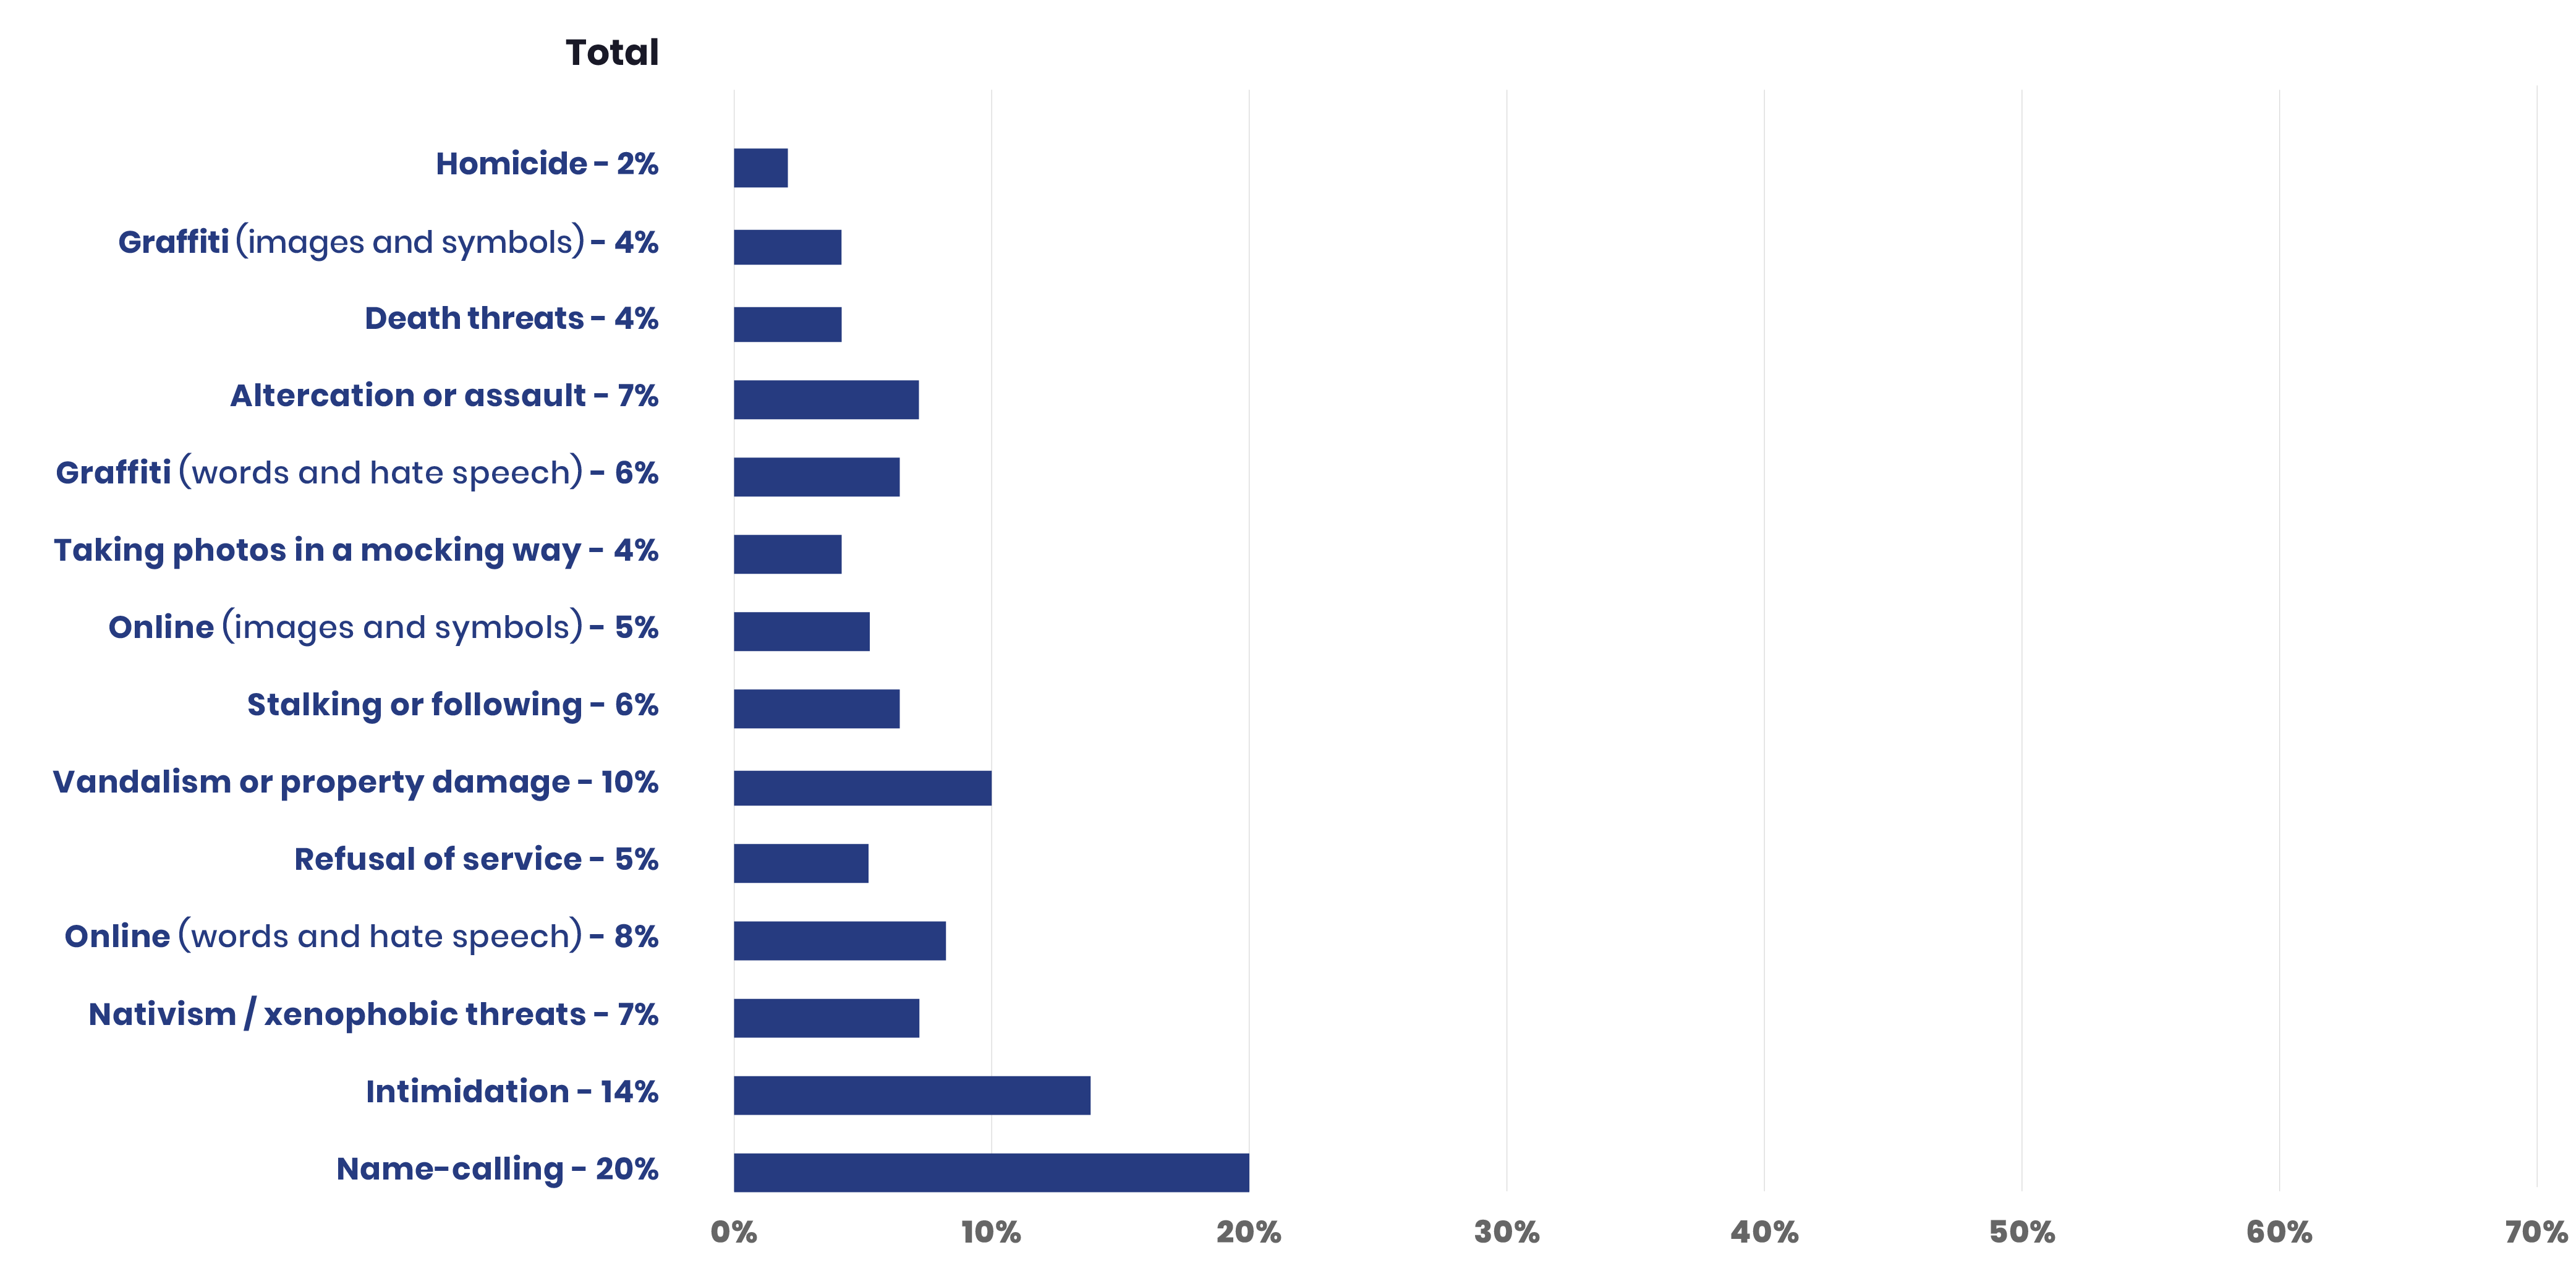
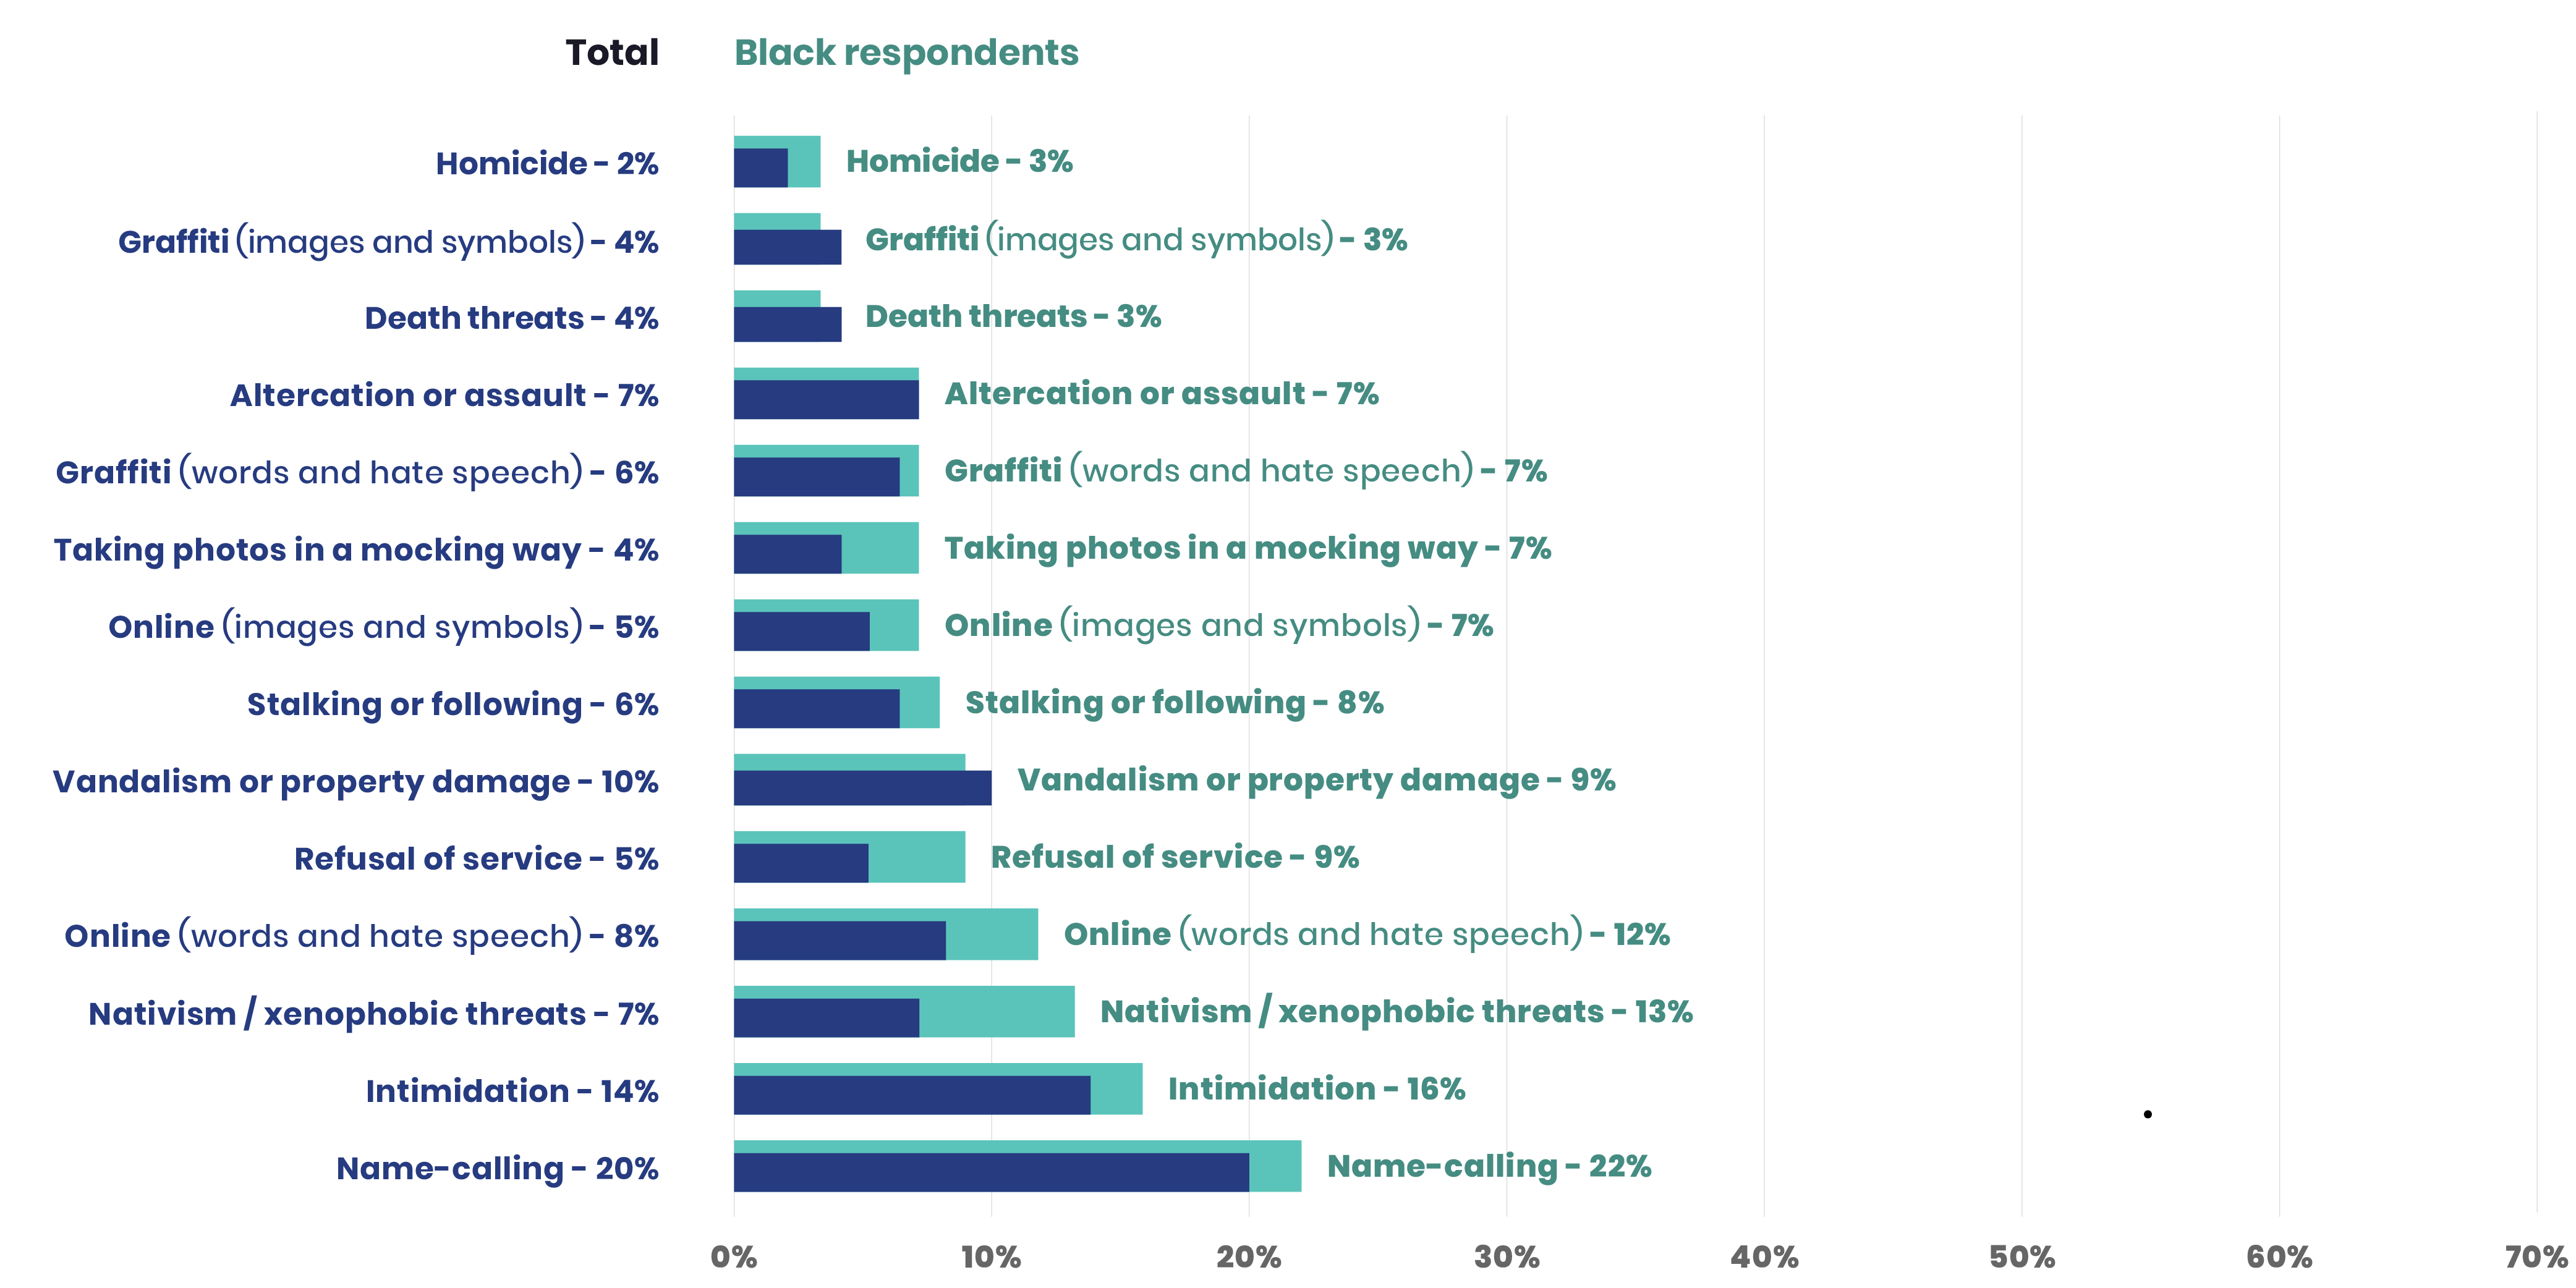
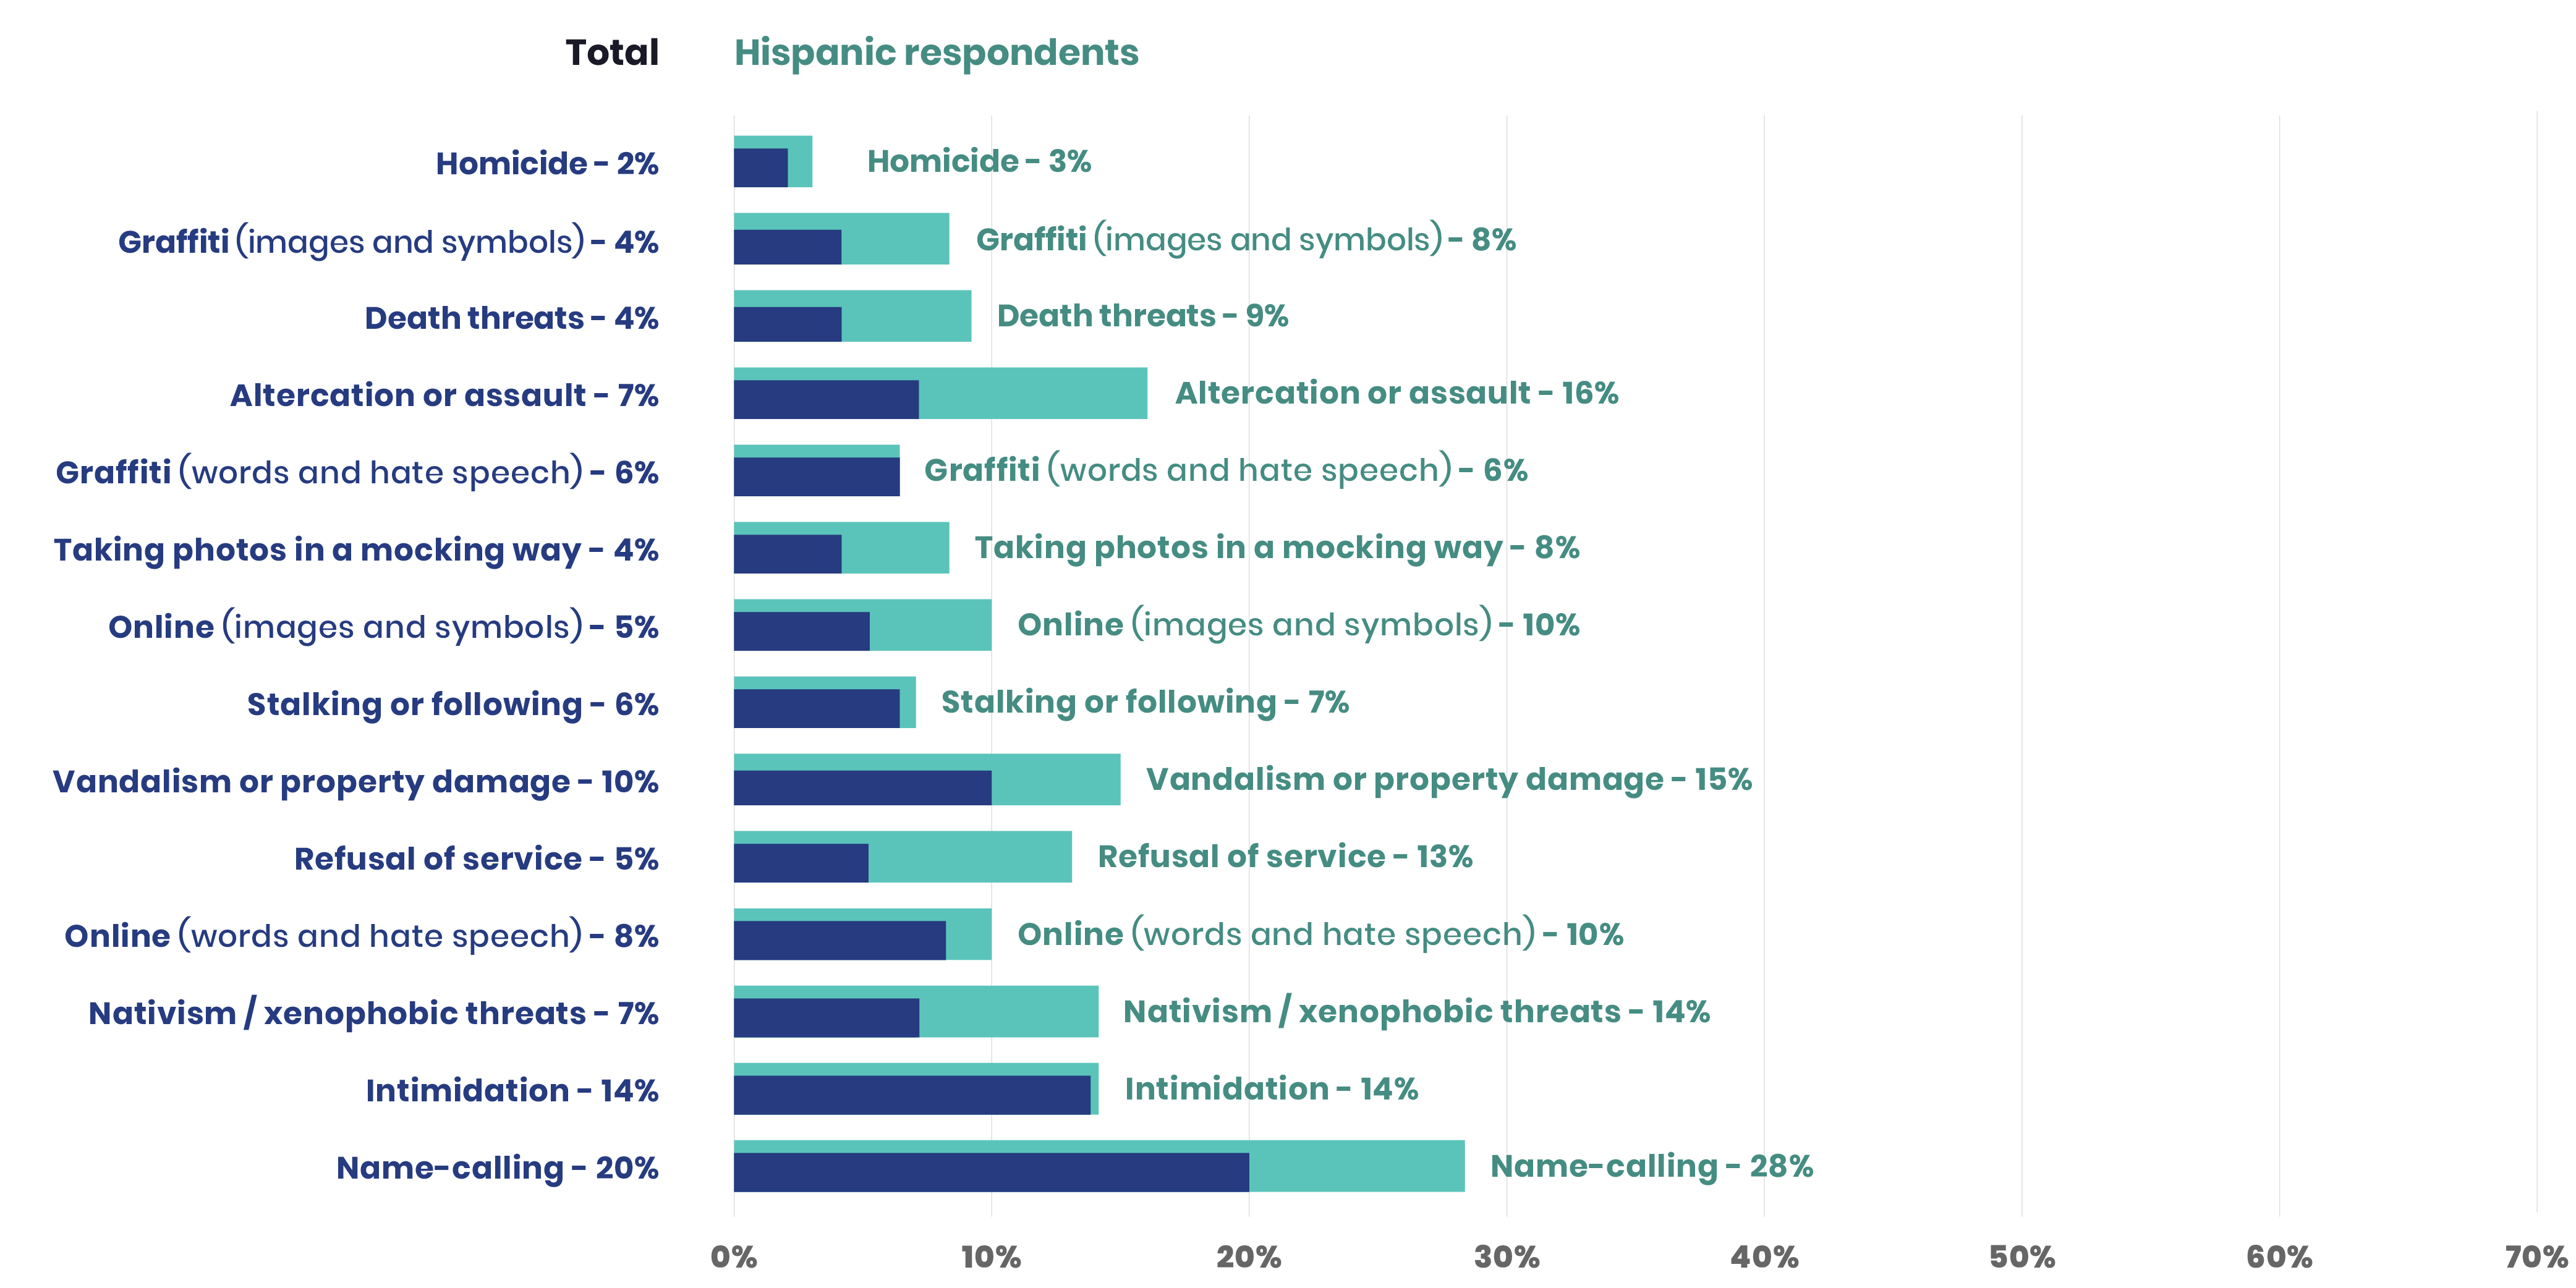
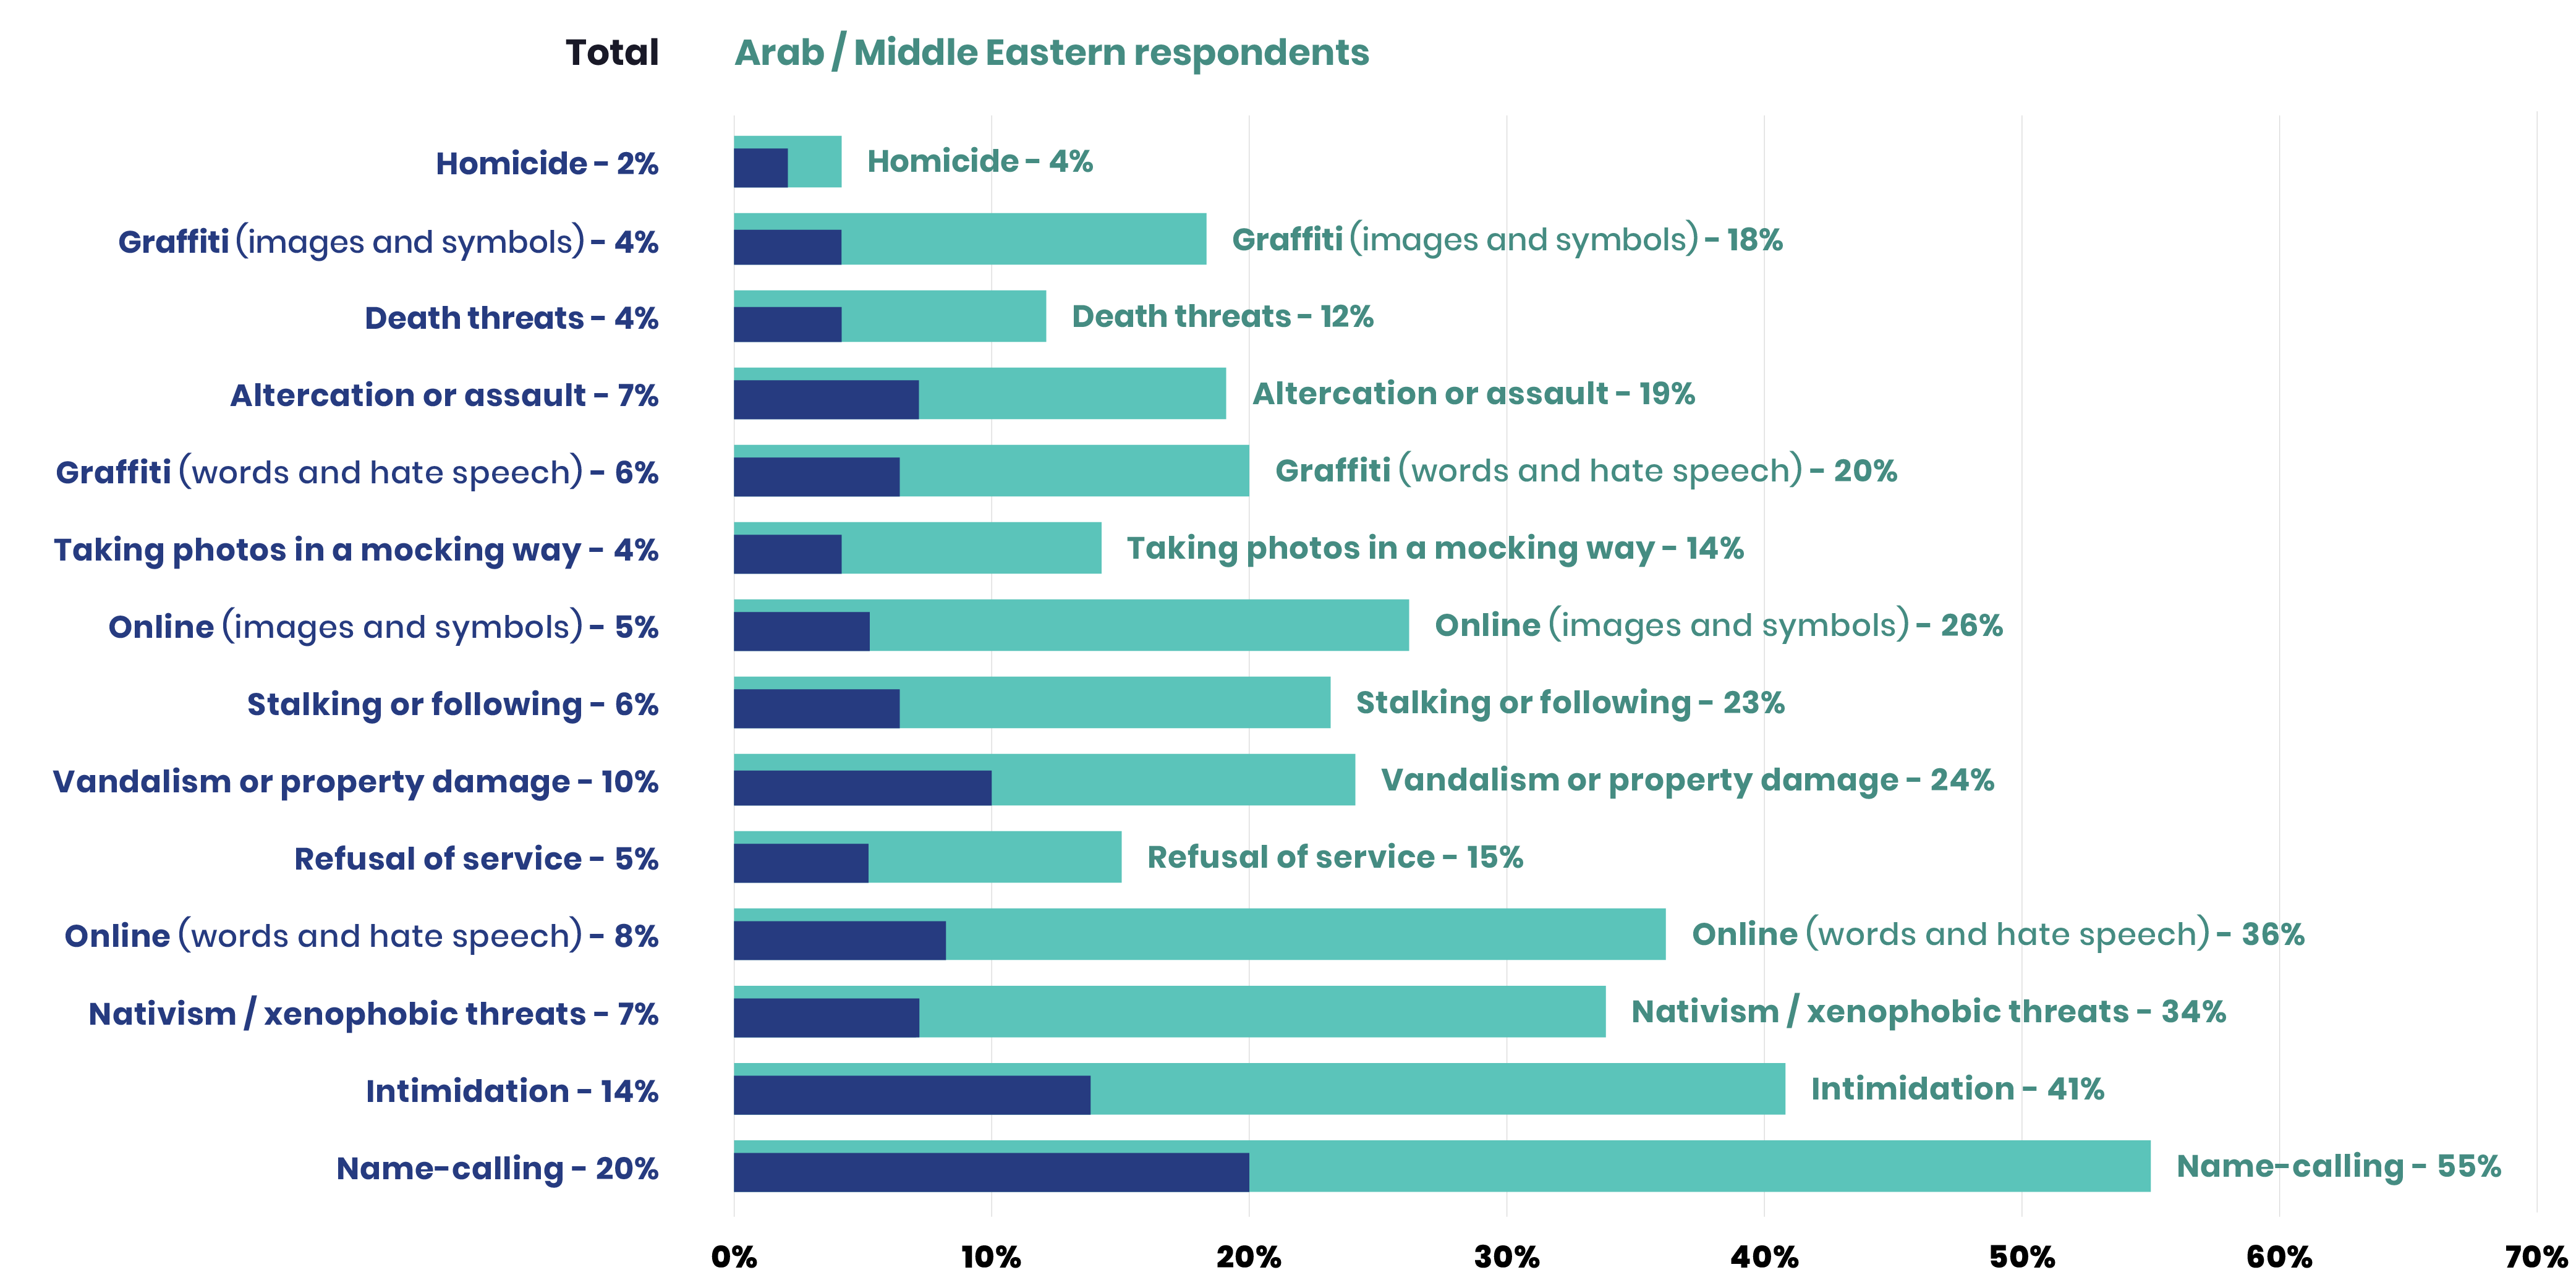
The most common trend of a hate incident in the CAH database is through the use of language. The plurality of incidents, at 41.47 percent in our database, reflects incidents of spoken abusive language in which an individual has been called a slur, told to “go back to their own country,” given a death threat, or been the target of other threatening or demeaning language. Individuals also commonly report experiencing or witnessing written abusive language either in the form of graffiti, threatening mail, online commentary, or other forms. Respondents in the Hate Incidence Poll were asked to comment on the most significant incident of hate they experienced in the last two years. Consistent with what we have found in the CAH database, poll respondents who experience hate say that the action that occurs most often is written or verbal abusive language (57 percent) including online words or speech, name calling, graffiti words and speech, online images or symbols, photos or videos, or graffiti images and symbols. Twenty-two percent of Black, 28 percent of Hispanic, and 55 percent of Arab/Middle Eastern respondents say they experience or witness “name calling.” Additionally, 13 percent of Black, 14 percent of Hispanic, and 34 percent of Arab/Middle Eastern respondents say they experience nativist or xenophobic threats.
Co-occurring Actions
Hate incidents often are perpetrated with multiple forms of attacks within one incident. Many respondents who report to the CAH database note that they experience or witness incidents that include multiple actions. The highest concurrent actions are written abusive language with property damage (17.01 percent), typically represented as vandalism. For example, in one incident, swastikas and other symbols were drawn with sharpie markers all over the hallways of a housing complex where mostly people of color and immigrants live. In one example, aggressor(s) vandalized a mosque with hate speech, urinated on the carpet, and stole money from the donation boxes. In this incident, the aggressor chose to attack the Muslim community by desecrating their place of worship while also communicating written abusive language on the mosque itself. The multiple actions in this incident confirm that the aggressors were targeting the mosque as an act of hate while also disrespecting and endangering the individuals who worship there. The next most common co-occurring action in the CAH database is spoken abusive language with physical harm (9.98 percent). For example, an individual sitting in his car was physically attacked while aggressors referred to him as a “terrorist.” He lost consciousness during the attack, and when he woke, his car had been stolen.
Within the CAH database, physical harm alone makes up a larger share of incidents, however many of those incidents have a correlating piece of evidence that connects the harm to hate among those defined as anti-Asian, anti-Lesbian, Gay, or Bi-sexual (LGB), and anti-Transgender, Gender-Nonconforming (TGNC) in nature. This is especially true for anti-TGNC incidents. For example, one report submitted to the CAH database read, “A student of mine was assaulted yesterday morning inside of [a business] close to our school. That student is a transgender female and a senior at our school. Prior to the assault, multiple eye witnesses reported hearing that the alleged assaulter could be heard saying clearly ‘I'm going to beat that tra***'s a**.’ She sustained serious injuries to her face and required multiple stitches.”
Invocations and Reference to Individuals or Hate Groups
This report does not exist to indict any individual or political party as the cause for hate but to provide data that illuminates what animates people to commit an incident of hate. To that end within the CAH database, during some incidents, invocations of politicians or hate groups are made to indicate the incident was on behalf of Trump or alt-right hate groups. Overall, a total of 1,444 hate incidents invoke the name of an alt-right hate group, Trump or Trump-related rhetoric, or other hate groups. Alt-right hate groups are invoked in 848 incidents (23.19 percent) and more commonly invoked or referenced in written abusive language (20.51 percent). While Trump is invoked in 16.30 percent of incidents, these invocations are more commonly expressed in spoken abusive language (9.51 percent). There are 91 database incidents (0.6 percent of all incidents that invoke Trump or hate group rhetoric) in which both an alt-right hate group and Trump are invoked and these mostly take the form of graffiti.
The most common type of incident referencing an alt-right group reported to the CAH database includes vandalism and written abusive language involving swastikas and other alt-right symbolism and statements (e.g. graffiti of trash bins, flyers put up around campus). For example, one individual reported: “Our recycling bins in our alley behind our home…were tagged with swastikas overnight. My husband is Jewish, my two children half-Jewish, so this is particularly concerning. Our neighbors' garage was tagged with swastikas as well. They are Muslim.” Of incidents referencing alt-right hate groups reported to the CAH database, the most common references are made to Nazism (including swastikas or references to Hitler or neo-Nazi groups) and the Ku Klux Klan (KKK). Nonetheless, incidents that include references to newer alt-right groups, such as Identity Evropa and True Cascadia, are also reported.
Hate incidents with references made to Trump often involve intimidation or physical harm and are most commonly done in-person. For example, one individual reported:
“As I was walking outside, there was a truck doing donuts near my car, so I was trying to hurry and get outta there before they noticed me. I was going to unlock the door and I heard them yell ‘hey n****r b***h! Get back on the boat back to Africa, and get the f**k out of America! This is the White man's land! Make America WHITE again!’ I was just standing there, completely shocked at what I had just heard. Before I could even process the situation, they had threw (sic) 2 gas station cups full of what I thought was soda all over me as they drove off screaming more obscenities. I got into my car and locked the doors, and began sobbing. It wasn't soda, it was all their spit from chewing tobacco mixed with some other nasty stuff.”
Multiple incidents were also reported to the CAH database in which Trump’s name was invoked during a hate incident affecting someone from a marginalized identity group. For example, one individual reported the following incident in the days after the 2016 election: “Last night, Monday, November 14, 2016, I witnessed a White man in a pick-up truck harassing an African-American driver who was directly in front of him, who was stopped at a red light. The White truck driver was revving up the truck, trying to bump the car in front of him, to force him to run the light into a busy intersection, while yelling ‘Donald Trump! Donald Trump! Donald Trump!’ through his open truck window. I was waiting for the light on my bike, right next to the African-American driver and was stunned. Thankfully the driver did not move or respond to this intimidation.” In another example, “A man seen shouting ‘go back to Asia’ and ‘God bless Trump, we're going to nuke you guys’ to a Korean American woman…[he] was punched in the face by a passerby because of his comments…”
Of incidents involving Trump-related rhetoric reported to the CAH database, four themes emerge: the Muslim ban, build the wall, grab her by the p****, and some variations of Make America Great Again (MAGA). For example, one advocacy organization reported, “[Individual] has problems with neighbor who started making abusive comments regarding Muslims and left notes on her door saying ‘Trump Travel Ban Now.’ Yells out of her house at [Individual]'s window ‘f*****, sand n*****, go back to your country.’ [Aggressor] throws bottles of water at the window. Starting 9/10, every day [Individuals] find urine on their patio furniture, and they strongly believe that it is from [Aggressor].” Another example reported stated, “At least one student was chanting about ‘building a wall’ near the Latino Living Center on campus.” In a third example of many, an individual reported, “A group of White male students gathered around a pick-up truck with a confederate flag decal in the high school parking lot shouting ‘grab her by the c***, f*** her up, Trump Trump Trump,’ while a mixed group of African American, Hispanic and White female students walked into school.”
In another example, someone reported that “Students living in [a] residence hall found four hand-written sticky notes on their door displaying pro-Donald Trump rhetoric. Three of the notes read: ‘Trump,’ ‘White Pride’ and ‘Make America White Again.’ The fourth bore a drawing of a swastika.” Another example stated, “At my workplace, a customer walked in ranting about how Trump is going to make America great and clean it up. He called me, directly and indirectly, an invader, a rapist, a murderer, and told that we need to be sent back to where we came from. That Donald Trump is gonna make that happen and that Americans need to watch out for us Puerto Ricans, followed by a Nazi salute and a smile. I told him it was not funny and that I am Puerto Rican and I tried to end the conversation 3 times at which the third time I became more stern and he finally ended it. Nothing was done by upper management who was present during the incident.”
Many people who are victims of hate incidents that include a reference to Trump or a hate group indicate feelings of fear, disgust, discomfort, and anger or frustration. It is easy to see how hate incidents invoking an alt-right hate group known for targeting individual people, often in the form of in-person attacks or vandalism, might generate fear. In addition to making the targeted individual fearful, alt-right hate group fliers also often generate fear throughout the greater community. For example, an incident read, “There have been weekly sightings of white supremacist posters in [city] since January of this year. They are often found in majority Somali neighborhoods and are causing the students and community members to fear for their safety.” In the CAH database, invocations of alt-right hate groups are far more common to occur at universities (third highest among all invocation of alt-right hate groups). The CAH database includes several entries that report on the plastering of recruitment or otherwise inflammatory posters at university campuses across the nation, showing a potential trend of recruitment specifically on college campuses (e.g. Identity Evropa flyers were found on campuses in South Dakota, Illinois, and Alabama, among others).
Motivation for incidents in the CAH database is determined at the point of intake of the form by the individual who witnesses or experiences a hate incident. Motivation is used to determine who is impacted by the incident. It may also be interpreted by the database manager or by the hotline manager, if not explicitly stated.

